
https://developers.google.com/speed/pagespeed/insights/
Fast and accurate Reports!
PageSpeed Insights ranks #3 as a top website report tool by Google, crucial for optimizing websites and enhancing user experiences. It evaluates loading speed and performance across devices, generating actionable reports to identify bottlenecks that hinder site speed and user engagement.
Armed with this knowledge, webmasters can streamline pages, improve load times, and provide seamless browsing experiences. Its impact on user satisfaction and search engine visibility makes PageSpeed Insights an essential resource for digital success.
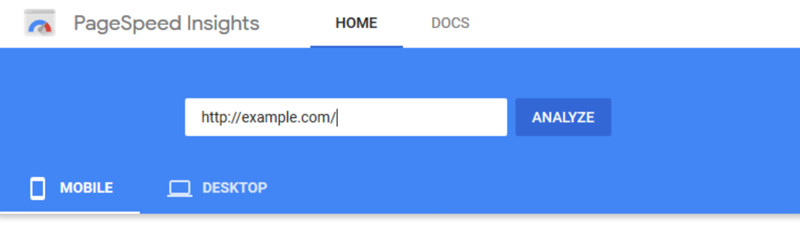
With PageSpeed Insights, the program uses mobile and desktop devices to report the performance of a web page.
PageSpeed Insights will evaluate the URL and grade the webpage based on a list of criteria. Included with the grade and scoring are suggestions to improve the performance of the webpage, if adjustments are needed. On the report, you will find the following information:
- URL Performance Score
- Real-World Field and Lab Data
- Performance Opportunities (suggestions on improvements)
- Webpage Diagnostics
- Passed Audits
Performance score
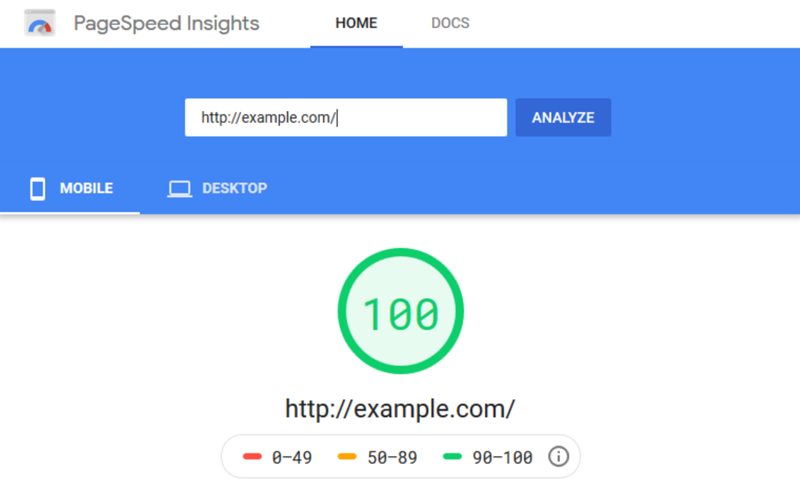
When viewing the report, at the top, PSI displays a score which is an overall grade of the page’s performance. The grade is calculated by running Lighthouse to capture and evaluate lab data about the webpage. A grade of 90 or higher is viewed as fast, while between 50 and 90 is considered average. If your grade is lower than 50, the webpage is considered as slow.
Real-World Field Data
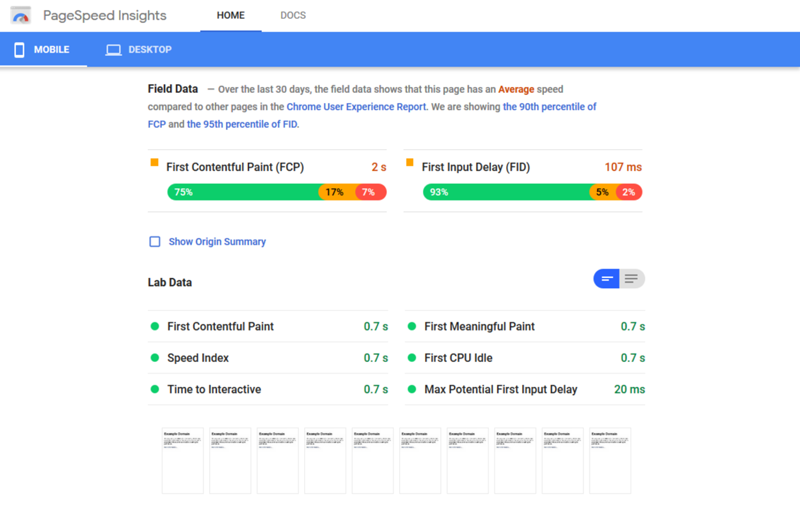
When a URL is entered into PageSpeed Inisghts, it will look up the URL in the Chrome User Experience Report (CrUX) dataset. If available, PageSpeed Insights reports the FCP (First Contentful Paint) and the FID (First Input Delay) metric data for the origin and specific page URL.
CLASSIFYING SLOW, AVERAGE, FAST
PageSpeed Insights classifies field data into three segments, reporting experiences as slow, average or fast. PageSpeed Insights sets the following benchmarks for slow, average and fast based on their analysis of the CrUX dataset:
FCP
- 0 – 1000ms = Fast
- 1000ms – 2500ms = Average
- 2500ms+ = Slow
FID
- 0 – 50ms = Fast
- 50ms – 250ms = Average
- 250ms+ = Slow
Pages that are fast are fast, generally speaking, are roughly in the top ~10%. Average speed webpages are in the next 40%. While slow webpages are in the bottom 50%. The numbers have been rounded for readability. The benchmarks given apply to both desktop and mobile. They have been setup based on human perceptual abilities.
Lighthouse separates its audits into three sections:
Performance Opportunities
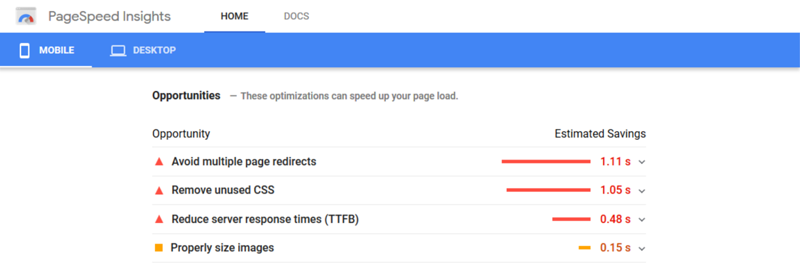
PageSpeed Insights offers performance suggestions which they call “opportunities.” These performance opportunities provide suggestions on how to improve a webpage’s performance metrics. Each suggestion includes an estimate of how much faster the page will load, IF.. the suggestion is implemented. This is extremely helpful for developers, as they don’t have to search for the areas of improvement, as they are conveniently listed.
Webpage Diagnostics
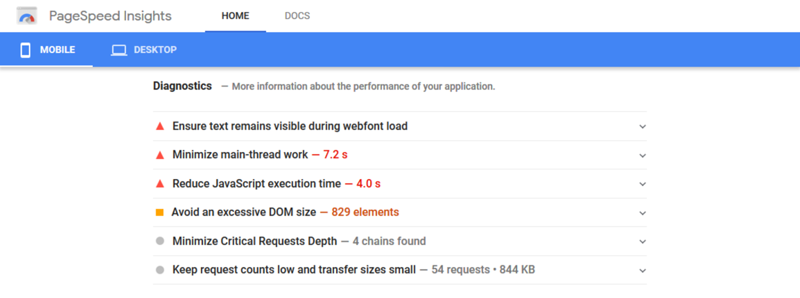
The diagnostics section of PageSpeed Inisghts provides additional information about how a page adheres to best practices for web development.
Passed Audits
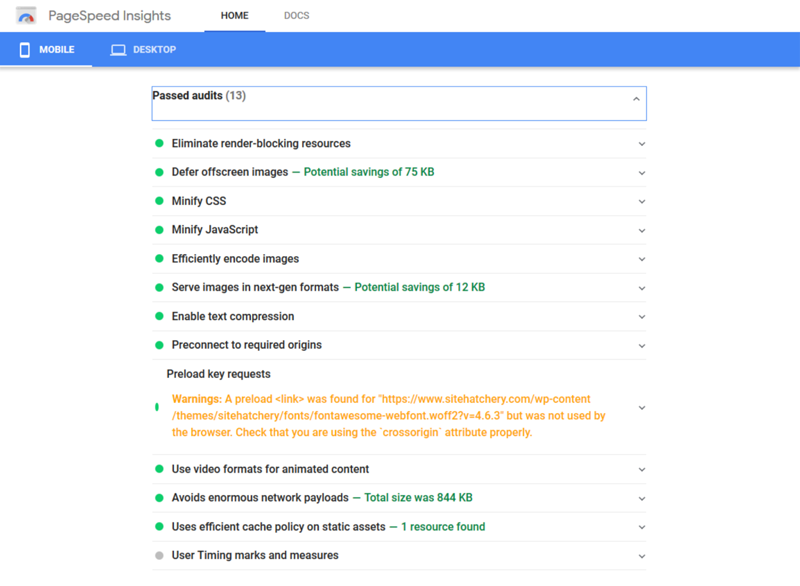
Passed Audits are audits that have been passed by the page. As shown in the image above, PageSpeed Insights will review the webpage and offer suggestions to bring the webpage to its optimal performance.