Sitehatchery website audit reports online chico California

The Ultimate Source for Website Reports


There are a myriad of helpful reports available which will help you know how to improve your business website. However, there are some that we think stand out from the rest. And so… we offer you our top top 10 list.

External Website links to the top 10 website reports:

And now for the deep dive…

1. Google Analytics

Visit Google Analytics Tool

As many know, Google offers a free analytics service. With Google Analytics, a code is added to the website which allows website owners to track and create reports based on website traffic.

Google Analytics - Tracking ID - Enter into WordPress Website

It’s quite the marketing tool. As a user of the platform, you can measure your advertising return on investment.(ROI). As well as track your website videos, flash, applications and even your social networking sites.

Google Analytics - Master View Dashboard

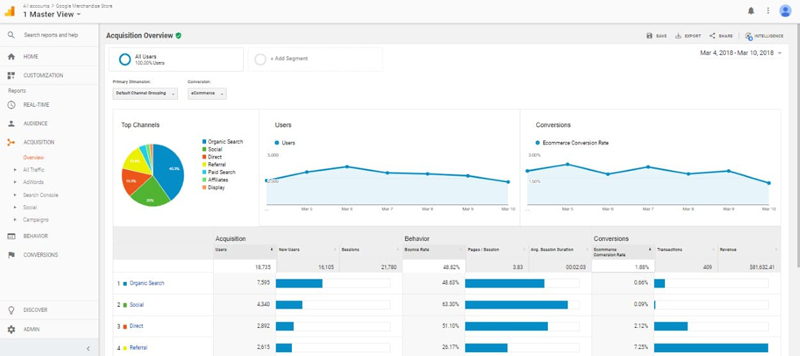
With Google Analytics, website owners and administrators can find the answers to commonly asked questions. Here are a few of the areas Google Analytics can help:

  • How many visitors does my website get?
  • What’s the location of my visitors – where are they from?
  • What are my visitors using most and is mobile development a concern?
  • Which websites are directing people to my website?
  • What marketing strategies are bringing visitor traffic to my website?
  • Which pages on my website are the most popular?
  • What blog articles are viewed most by visitors?
  • How many visitors have converted into leads or customers?
  • How do converting customers navigate on the website – where do they go?
  • Where do my converting visitors come from – what is their location?
  • What can I do to improve my website’s speed?

With Google Analytics, you can dissect a website to be monitored and reported in a variety of ways. With the endless options for reporting, Google Analytics can answer almost any question that website owners and marketers come up with.

Real Time

Google Analytics - Real Time

With the Real Time feature, data updates continuously to the overview dashboard. Each pageview is reported seconds after it occurs, giving you a real time overview of what visitors are doing on your website. With Real-Time, users can know the following:

  • The number of visitors on your site right now
  • Your visitors geographic locations
  • The keywords and sites that referred your visitors
  • Which pages your visitors are viewing
  • Conversions of your visitors as they happen
Audience

Google Analytics - Audience

Within the Audience Reports, there are fifteen separate reporting sections – three of which are Beta at the time of this article. Each section features an easy-to-understand sessions graph which includes a table chart showing the acquisition, behavior and conversions data for each group.

The (15) segments in the Audience reports will help with the following:

  • How many Active Users have been on your website
  • The Lifetime Value (Beta) of a visitor
  • A before and after comparison (over time) of website visitor activity.
  • Grouping visitors together in special groups, or audiences that share a common attribute
  • Isolate and examine individual visitors
  • Determine Age, and Gender of your website visitors
  • Find out the special buying interests of your visitors
  • Discover the location of your visitors and the language used
  • See how many visitors, new versus returning visitors, are coming to your website and their frequency
  • See what OS and Browser your visitors are using, along with the network that brought them to the website
  • View website traffic based on Desktop and Mobile users
  • Organize data across multiple devices into a cohesive analysis, so you get a better idea of how seemingly unrelated touch points, sessions, and interactions are connected.
  • Use custom variables to track and report website activity
  • Find out how you are doing compared to your competition by viewing industry aggregated data
  • See the flow of your users as they enter, browse and exit your website
Acquisition

Google Analytics - Acquisition

With the Acquisition reporting feature in Google Analytics. Website owners can measure the performance of various traffic sources through conversion analysis and behavior. Such as whether or not a visitor came from a paid marketing ad, a search query or even an advertisement on social media. Within the report, there are four main segments which dive deep into how your visitors were acquired.

These (4) main segments are:

  • Google Ads
  • Search Console
  • Social
  • Campaigns
Behavior

Google Analytics - Behavior

Google Analytics Behavior reports the behavior of your website visitors and their path to conversion. This report allows website owners and administrators to understand precisely how visitors interact with your site.

With the Behavior feature, there are seven segments included with the report which can be utilized. These (7) sections are:

  • Determine which content is most engaging by seeing the behavioral flow visitors take on your website, from one page to the next
  • Discover which of your site content is engaging and effective
  • Evaluate your website’s speed and find improvements
  • Review the search terms your visitors are using in the website search box
  • Setup and monitor events taking place on your website by visitors
  • Review Google AdSense ads and how well they are performing on your website
  • Conduct experiments to improve goal conversion by testing different page designs
Conversions

Google Analytics - Conversions

With Google Analytics Conversions, website owners and administrators can create and generate reports based on completed actions. These completed actions are when a visitor goes from being a visitor, into a customer. They convert from one to the other. How this process is determined is based on the definition of a conversion to a website owner. A conversion could be something simple as a visitor filling out a form on your website. Or, for the Ecommerce store, it could be the moment someone completes a purchase. A conversion could also be described as someone who has a high-level of engagement with your website, meeting a certain criteria of completed steps before being recognized as a customer.

With Google Analytics Conversions, there are four segments which will help you understand the conversion process of your visitors. These segments are:

  • Goals
  • Ecommerce
  • Multi-Channel Funnels
  • Attribution
Custom Reports

Google Analytics - Custom Reports

Setting up and dissecting website data involves time. There are alternatives which allow for custom reports to be made, freeing up time for website owners and administrators. Website data can be aggregated and reported. Custom reports are helpful for those who want to receive information about their website, but don’t have time to generate specialized reports. Having a reporting system in place like Google Analytics will help website owners and administrators understand their website performance, their visitors, and how users interact within the site. Having this information available allows for quicker and exact decision making, in addition to calculated marketing. Whether you are hands on or have someone generate a customized report for you. The data is always necessary to help build a successful website.

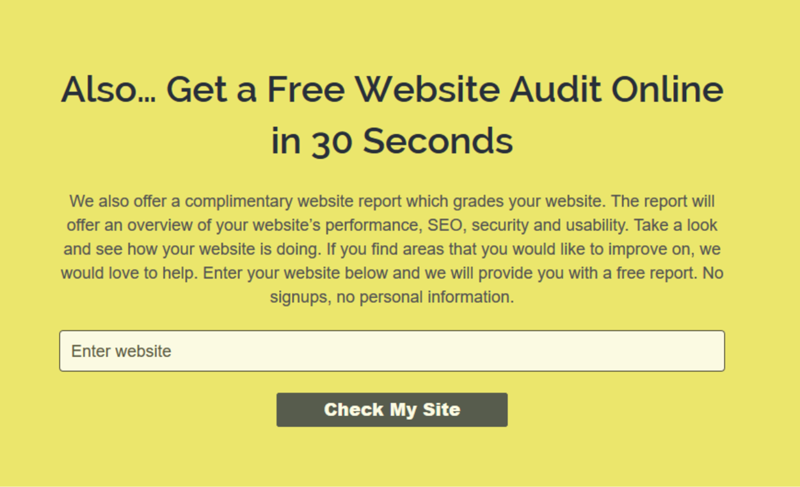
2. Website SEO Audit Tool

Visit SiteHatchery SEO Audit Tool

The Website SEO Audit Tool is a free multi-purpose tool that evaluates and grades websites based on the strength of various SEO factors. The metrics are a valuable component for website developers who want to make their website perform better for users and rank better in search engines.

Website SEO Audit Tool - Monthly Website Reports

When a webpage or target URL is tested, the report will display an overall Grade using an A+ to F- scale.

Website Audit Tool - Overall Grade

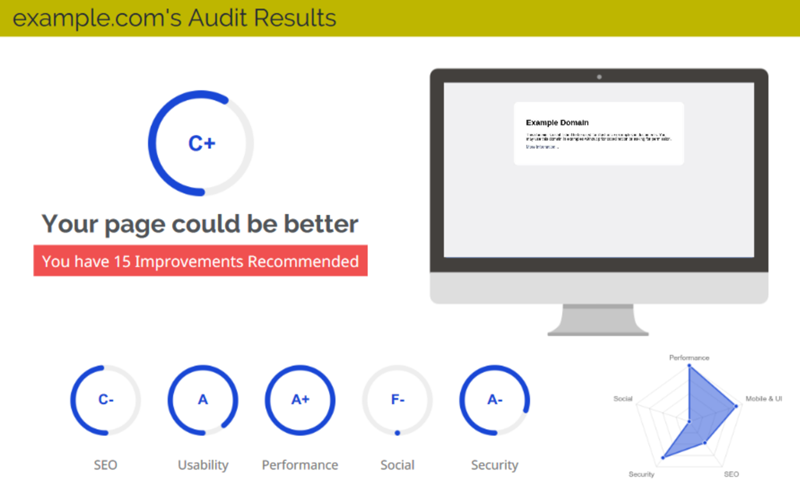
The testing process focuses on five key areas. These areas are:

  • SEO
  • Usability
  • Performance
  • Social
  • Security
Child Pages

Website Audit Tool - Child Pages

Included with the test results will be a list of child pages found within the target URL. Child Pages are pages found within webpage, internal links that lead to posts or other pages. In the example above, there are no child pages found since the webpage serves as a single page demo site.

SEO Results

Website Audit Tool - SEO Results

The first of the five key areas tested deals with SEO. In this area, the Website Audit tool tests to see if your webpage is optimized from an SEO perspective. SEO optimization is important as it will enure a website can maximize its ranking potential and drive traffic to its website from search engines. Here are the factors that determine the SEO grade.

HTML Header

Website Audit Tool - HTML Header

TITLE TAG
Title tags are titles for a page and are displayed within the serach results of a browser. A good title tag should correspond with the content on the page and be between 10 and 70 characters.

META DESCRIPTION
The meta description is the small blurb listed on the search results. This is the description below the title tag. The meta description is a small description about the content of the page, a summary of what is to be expected on that page. This description helps search engines understand the content of your page.

Body Content

The Body Content section looks at how your content is formatted and displayed on the webpage. The Body Content section grades on the following areas:

  • Header Tags
  • Keyword Consistency
  • Amount of Content
  • Image Alt Attributes

Website Audit Tool - Body Content

HEADER TAGS
Headings are important on a webpage. The headings on a page separate the content and signals search engines the important content topics of your page, and the keyword the webpage should be ranking for.

KEYWORD CONSITENCY
Keywords are works that are used to describe the services, products, or information about your website. Consistent use of keywords tell search engines what your website is about. The keywords gathered from websites feed into the search engine’s algorythm and depending on the ranking value of the website, will display the results within a particular order. Keywords for a website should fall within the realm of the industry of the business. For instance, if someone sells clothing online – they will want to use keywords like “brand names, styles, genre and more.”

AMOUNT OF CONTENT
The amount of content on a webpage helps search engines with understanding what your website is about. If I were to give a single sentence about our company, and what we do. The reader may have a general overview, but surely not a clear and precise vision. If I were to create a few paragraphs highlighting who we are, how we started, what we are about and why we do what we do. The visitor would have a clearer understanding about us. The same with search engines, by having a content rich page, search engines can use the information to build a framework of what the page is about – directing visitors to you who have a need for that particular type of information.

IMAGE ALT ATTRIBUTES
Images play a role in the search results process. Images that are added to a website will be reviewed and used for placement within the results of a search query. It’s important to name your file to what the image is about and include a description of the image as a “alt” attribute. This is a hidden description of the image, used by search engines to gain knowledged of the image and what it’s about.

Links

The Links tool reviews and reports the statuses of links on the page, and websites referring links back to it.

Website Audit Tool - Links

In addition, the links tool will review the page link structure. Looking to see if links are being followed or not, while at the same time checking for:

  • Broken Links
  • Friendly URLs
Other

The “Other” tool reviews and monitors a website for files that help with search engine instruction and traffic monitoring.

Website Audit Tool - Other

The areas of focus are:

  • Robots.txt
  • XML Sitemaps
  • Analytics

ROBOTS.TXT
Whether or not the website being tested contains a robots.txt file. The robots.txt file is recommended for website, as it can provide important instructions to a search engine for how to most appropriately crawl a website – as well as site areas that should be ignored.

XML SITEMAPS
Checks to see if a XML Sitemap is included with the website. A sitemap includes a list of webpages that are available for crawling, as well as other useful information for search engines such as last update times and priority of pages. Sitemaps are recommended to ensure that search engines can intelligently crawl all of a website’s webpages.

ANALYTICS
Verifies whether your website uses an analytics tool like Google Analytics assist websites in measuring, analyzing and ultimately improving traffic to a website.

Usability

The Usability section covers how well your the website is used across devices.

Website Audit Tool - Usability

The tool gives a grade, using the A+ through F- scale. Websites that are built to be responsive will have content formatted for all viewing port sizes, allowing visitors the same level of experience regardless if they are on mobile device or desktop PC.

Areas of focus:

  • Use of Mobile Viewports
  • Flash Used
  • iFrames Used
  • Favicon
  • Legible Font Sizes
  • Tap Target Sizing
Performance Results

The Performance test reviews how well your website performs, both for speed and responsiveness.

Website Audit Tool - Performance Results

The test focuses on the following performance areas of your website:

  • Page Speed Information
  • Page Size Information
  • Number of Resources
  • JavaScript Errors
  • GZIP Compressions
  • Optimize Images
  • Minification
  • Deprecated HTML
  • Inline Styles
Social Results

The Social results tool checks for a website’s social presence and activity.

Website Audit Tool - Social Results

The importance of social activity is for customer communication, brand awareness, and as a marketing channel to bring visitors to a website. Social media channels searched for are:

  • Facebook
  • Twitter
  • Instagram
  • YouTube
  • LinkedIn
  • Social Shares
Security Results

The Security tool searches a website for certain security measures that help websites against attacks.

Website Audit Tool - Security Results

Security is important for a website as it protects data from being compromised. Security of a website also plays an active role in raising a website visitors assurance when it comes to entering personal details – knowing the information is protected.

The Security tool reviews the following:

  • SSL
  • HTTPS Redirect
  • Malware Check
  • Email Privacy
Technology Results

The Technology Results section identifies the software or coding libraries on a website.

Website Audit Tool - Technology Results

The technology reviewed for are:

  • Technology List
  • Server IP Address
  • DNS Servers
  • Web Server
  • Charset
Recommendations

At the end of the report there is a section called recommendations. These recommendations allow website evaluators to see what areas they should focus on, if they want to improve the testing results of their website.

Website Audit Tool - Recommendations

By following the outline of suggestions above. A website can achieve a higher level of performance.

3. PageSpeed Insights

https://developers.google.com/speed/pagespeed/insights/

PageSpeed Insights (PSI) is a performance grader for web pages.

PageSpeed Insights - Homepage

With PageSpeed Insights, the program uses mobile and desktop devices to report the performance of a web page.

PageSpeed Insights - Target URL Test Tool

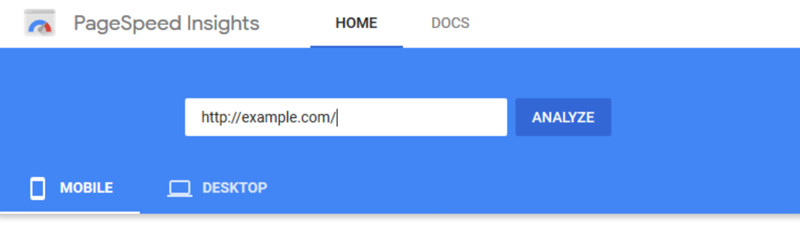
PageSpeed Insights will evaluate the URL and grade the webpage based on a list of criteria. Included with the grade and scoring are suggestions to improve the performance of the webpage, if adjustments are needed. On the report, you will find the following information:

  • URL Performance Score
  • Real-World Field and Lab Data
  • Performance Opportunities (suggestions on improvements)
  • Webpage Diagnostics
  • Passed Audits
Performance score

PageSpeed Insights - Performance Score - Mobile

When viewing the report, at the top, PSI displays a score which is an overall grade of the page’s performance. The grade is calculated by running Lighthouse to capture and evaluate lab data about the webpage. A grade of 90 or higher is viewed as fast, while between 50 and 90 is considered average. If your grade is lower than 50, the webpage is considered as slow.

Real-World Field Data

PageSpeed Insights - Field and Lab Data

When a URL is entered into PageSpeed Inisghts, it will look up the URL in the Chrome User Experience Report (CrUX) dataset. If available, PageSpeed Insights reports the FCP (First Contentful Paint) and the FID (First Input Delay) metric data for the origin and specific page URL.

CLASSIFYING SLOW, AVERAGE, FAST

PageSpeed Insights classifies field data into three segments, reporting experiences as slow, average or fast. PageSpeed Insights sets the following benchmarks for slow, average and fast based on their analysis of the CrUX dataset:

FCP

  • 0 – 1000ms = Fast
  • 1000ms – 2500ms = Average
  • 2500ms+ = Slow

FID

  • 0 – 50ms = Fast
  • 50ms – 250ms = Average
  • 250ms+ = Slow

Pages that are fast are fast, generally speaking, are roughly in the top ~10%. Average speed webpages are in the next 40%. While slow webpages are in the bottom 50%. The numbers have been rounded for readability. The benchmarks given apply to both desktop and mobile. They have been setup based on human perceptual abilities.

Lighthouse separates its audits into three sections:

Performance Opportunities

PageSpeed Insights - Performance Opportunities

PageSpeed Insights offers performance suggestions which they call “opportunities.” These performance opportunities provide suggestions on how to improve a webpage’s performance metrics. Each suggestion includes an estimate of how much faster the page will load, IF.. the suggestion is implemented. This is extremely helpful for developers, as they don’t have to search for the areas of improvement, as they are conveniently listed.

Webpage Diagnostics

PageSpeed Insights - Website Diagnostics

The diagnostics section of PageSpeed Inisghts provides additional information about how a page adheres to best practices for web development.

Passed Audits

PageSpeed Insights - Passed Audits List

Passed Audits are audits that have been passed by the page. As shown in the image above, PageSpeed Insights will review the webpage and offer suggestions to bring the webpage to its optimal performance.

4. Sucuri SiteCheck Website Security Scanner

sitecheck.sucuri.net

Sucuri Sitecheck is a free website security checker.

Sucuri SiteCheck Website Security - Homepage

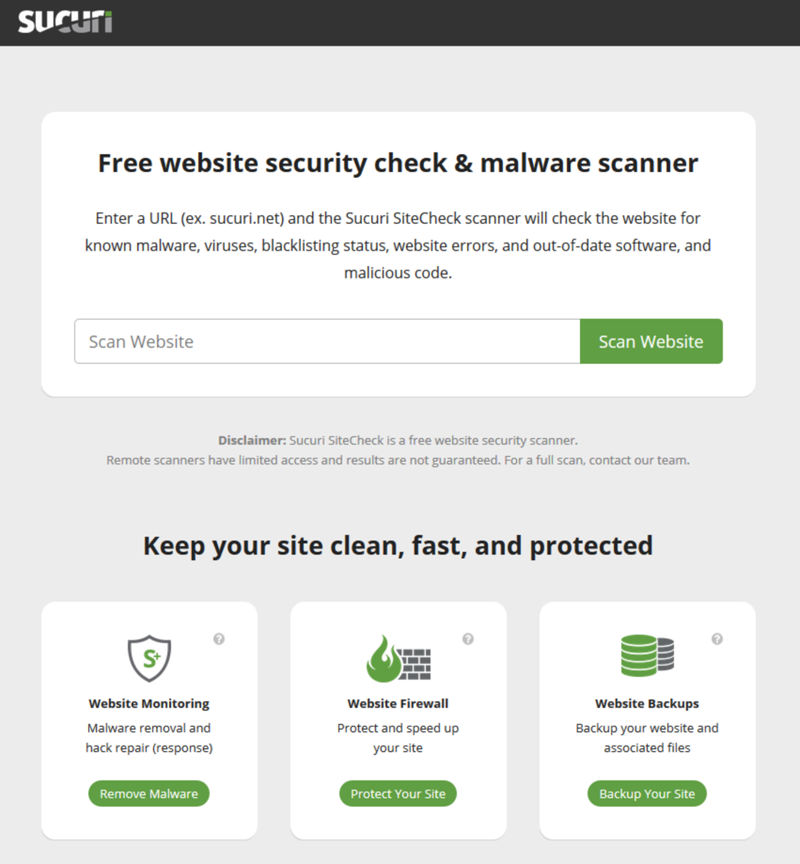
Sucuri Sitecheck scans for errors, viruses, blacklist status, malware and out of date plugins and software.

Sucuri SiteCheck Website Security - Test Results

The Website Malware & Security will tell you yes or no if problems exist:

  • No malware detected by scan (Low Risk)
  • No injected spam detected (Low Risk)
  • No defacements detected (Low Risk)
  • No internal server errors detected (Low Risk)

The Website Blacklist Status will if your domain is:

  • Domain clean by Google Safe Browsing
  • Domain clean by Norton Safe Web
  • Domain clean by McAfee
  • Domain clean by Sucuri Labs
  • Domain clean by ESET
  • Domain clean by PhishTank
  • Domain clean by Yandex
  • Domain clean by Opera
  • Domain clean by Spamhaus

Sucuri SiteCheck Website Security - Blacklists - Malware - Security

Hardened improvements may be recommended to tighten up the security level of your website.

Like adding a Firewall to Protect your website against hacks and DDoS attacks.

They also include details about security headers for XSS Protection, to prevent Content Sniffing, and Strict Transport Security.

Sucuri SiteCheck Website Security - Hardening Improvements - Protection and Security

5. Wave Accessibility Evaluation Tool

wave.webaim.org

WebAIM WAVE Accessibility Evaluation Tool - Homepage

Using WebAIM’s WAVE allows website designers and developers to evaluate web content for accessibility issues. The WAVE program will review the webpage URL notify you of their evaluation using icons and indicators. Each icon, box, and piece of information added by WAVE presents some information about the accessibility of your page.

Summary

WebAIM WAVE Accessibility Evaluation Tool - Overview and Summary

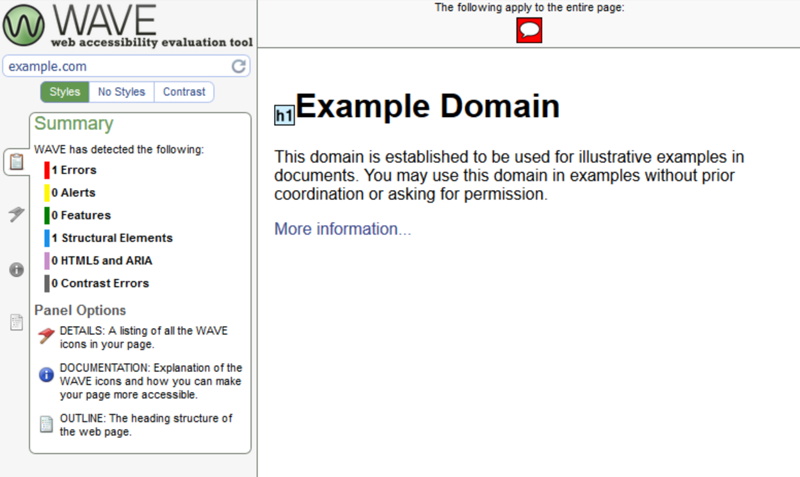
The WAVE Summary displays the results of its page evaluation, highlighting the performance of the page in the following areas:

  • Errors
  • Alerts
  • Features
  • Structural Elements
  • HTML5 and ARIA
  • Contrast Errors

While including information about the other 3 sections available within the reporting tool. Those three sections are:

  • DETAILS: A listing of all the WAVE icons in your page.
  • DOCUMENTATION: Explanation of the WAVE icons and how you can make your page more accessible.
  • OUTLINE: The heading structure of the web page.
Details

WebAIM WAVE Accessibility Evaluation Tool - Page Details

When a webpage is reviewed, the page will be displayed within the WAVE window with icons added to the areas of improvement. These icons are listed within the summary and are broken down in the details section. Each issue will be categorized and will include an explanation of the accessibility issue.

Documentation

WebAIM WAVE Accessibility Evaluation Tool - Page Documentation

The documentation category provides information on how WAVE came up with their determination of an accessibility issue. Inside the documentation section, website developers and designers will learn the following areas of each issue:

  • What the issue means
  • Why the issue matters
  • How to fix the issue
  • The Algorithm
  • Links to global Standards and Guidelines when it comes to website accessibility
Outline

WebAIM WAVE Accessibility Evaluation Tool - Page Outline

The outlines section within WAVE lists all headings within the webpage. The headings will be grouped together by rank and will be listed in a descending order, starting with H1. Titles for each heading found on the page are also included, making it easy to evaluate your heading structure.

Styles | No Styles | Contrast

The WAVE program displays accessibility information in three ways:

  • Styles
  • No Styles
  • Contrast

WebAIM WAVE Accessibility Evaluation Tool - Page Styles

In the “Styles View”, WAVE presents your page with embedded accessibility icons and indicators. Due to the complex nature of this view, creating reports for webpages with complex, CSS powered layouts may become difficult to read. If that is the case with your webpage, you can opt for the No Styles view.

NOTE: Wave offers Firefox or Chrome extensions which can often provide a more thorough analysis of a webpage that are known for being highly complex or dynamic.

WebAIM WAVE Accessibility Evaluation Tool - Page No Styles

The “No Styles View” displays your page with styles disabled and tables linearized. This view presents the underlying reading and navigation order, the order in which keyboard-only and screen reader users will access the page.

WebAIM WAVE Accessibility Evaluation Tool - Page Contrast

The “Contrast View” shows only contrast issues on your page, based on WCAG 2.0 guidelines. You can use the tools in the details panel to review your color contrast, and even get updated colors that meet these guidelines.

NOTE: In addition to the views above, you can select the Code tab at the bottom of the page to view the underlying markup/DOM of your page.

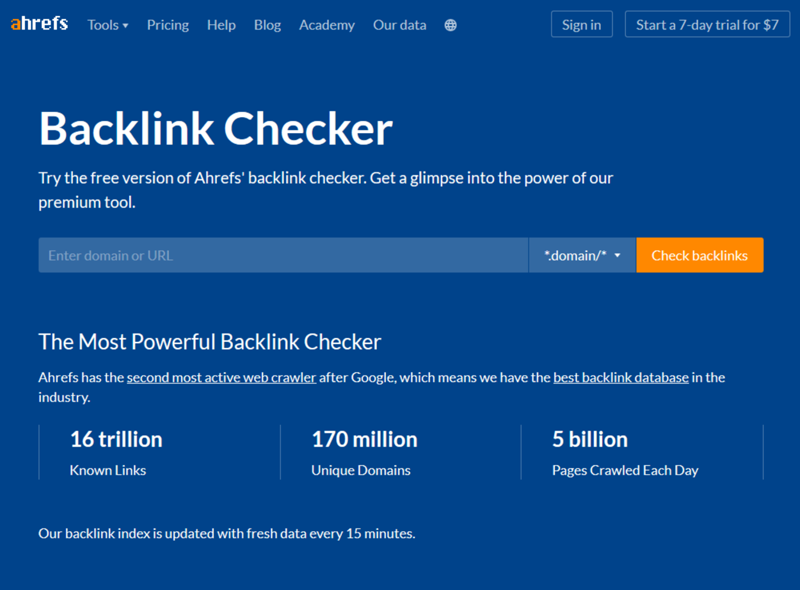
6. AHREFs Backlink Checker

Visit AHREFs Backlink Checker Tool

Ahrefs - Homepage - URL Search Bar

Ahrefs.com is a valuable tool for website owners, administrators, designers and developers who want to know their backlink and SEO analysis.Presently, they stand out from the crowd who offer similar services due to having the largest base of live links, a huge Index and the fastest speed when it comes to index updates.

Domain and Page Level Metrics

Ahrefs - Domain and Page Level Metrics - Graph

Review and see domain and page level metrics for any URL target. Review any website, URL of subsection to see insightful and actionable Search Engine Optimization (SEO) metrics.

  • Number of referring domains
  • Number of backlinks
  • Domain Rating (DR) & URL Rating (UR)
  • Ahrefs Rank (AR)

Ahref’s proprietary Domain Rating (DR) and URL Rating (UR) metrics are extremely handy for evaluating the backlink popularity (strength) of a target.

Monitor Growth and Decline of your Backlinks and SEO

Ahrefs - Monitor Growth and Decline

Look at an interactive view of referring domains and pages over time.

Breakdown of the Target URL’s Backlink Profile

Ahrefs - Breakdown Targets Backlink Profile

Using the Backlinks reporting eature. Get a list of every page linking to your target URL. Dive deep into the reports by using powerful filters.

Filter and sort by:

  • Language
  • Link type (“dofollow” / “nofollow”)
  • Platform
  • Domain Rating (DR)
  • URL Rating (UR)
  • Referring domains
  • Etc.
View Estimated Organic Traffic to each Linking Page and Referring Domain

Ahrefs - Organic Traffic - Linking Page - Referring Domain

Find helpful insights of the popularity of the linking webpage (and website) with organic traffic estimates. There are currently no other tools which offer this awesome feature.

Review All Websites Linking to your Target URL with Domain-Wide Metrics

Ahrefs - Website Linking Metrics - Part 1

Within the Referring Domains report. Users can review every linking domain to their target URL, along with handy SEO metrics

Get information on:

  • Domain Rating (DR)
  • Ahrefs Rank (AR)
  • Referring domains (followed)
  • Linked domains (followed)
  • Estimated organic traffic
  • Links to target (total & followed)

Ahrefs - Website Linking Metrics - Part 2

Quickly find any linking domain with the search feature.

View the most linked-to pages

Ahrefs - Most Linked Pages - Part 1

Using the Best Links report. Find link-worthy pages by exploring your competitor’s most “linked-to” pages.

Ahrefs - Most Linked Pages - Part 2

Create a “broken link building” campaign by using the “404 Not Found” filter. Find highly linked-to broken pages on any website.

View all outbound links broken down

Ahrefs - Outbound Links - Part 1

The outbound Links report shows all linked domains with SEO Metrics.

  • Domain Rating (DR)
  • Ahrefs Rank (AR)
  • Total followed referring domains
  • Total followed linked domains
  • Estimated organic traffic
  • Number of links from the target (total & followed)

Ahrefs - Outbound Links - Part 2

AHREF also shows broken links of the targeted URL. Running the Broken links reports, users can see which links need attention. There is also a report to help with Anchor text, showing a complete breakdown of anchor text.

Comprehensive Link Analysis Features

Ahrefs - In Depth Webpage Analysis

When it comes to AHREFs Backlink Checker, there are additional features to the service which makes their website special:

  • View followed and nofollowed links
  • Backlink anchor text
  • Disavow link spam
  • Export to PDF and CSV
  • Inbuilt filters, in every report

7. MX Toolbox DNS/MX Lookup

mxtoolbox.com

MXToolbox - Homepage - Signup

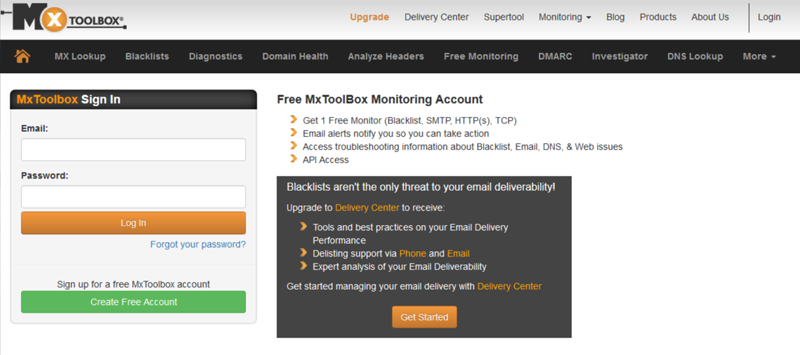
MXToolbox is probably one of the lesser known reporting tools, due to its higher level of reporting. MXToolbox is a powerful Mail Exchange / MX Records server tool which helps analyze and monitor server systems. They offer free lookup tools, along with a couple paid monitoring solutions. MXToolbox is a valuable piece of software to have in your arsenal that makes life easy for anyone who does network or system administration.

In MXToolbox, there are nine product service features listed in the menu. These are not all the services they offer, but these are the main system tools which can be found within the menu. These system tools are:

  • MX Lookup
  • Blacklists
  • Diagnostics
  • Domain Health
  • Analyze Headers
  • Free Monitoring
  • DMARC
  • Investigator
  • DNS Lookup
MX Lookup

MXToolbox - MX Lookup

In the MX Lookup. The search bar will allow users to perform a test on a domain and list the Mail Exchange Records in priority order. The Mail Exchange (MX) Lookup is performed against the domain’s server. This means changes that are made should appear instantly.

Blacklists

MXToolbox - Blacklists

In the Blacklist category. The blacklist check function will test a mail server IP address against 100 DNS based email blacklists. If your mail server has been backlisted, emails you send may not be delievered. Email blacklists are common and aid in the reduction of junk mail or spam. To find your mail server’s address, start with the Mail Exchange (MX) Lookup tool listed above.

Diagnostics

MXToolbox - SMTP Diagnotics

The Diagnostics test will connect to a mail server by Simple Mail Transfer Protocol or SMTP for short. Once connectected, the Diagnostics feature will perform a simple Open Relat Test, verifying the server has a reverse DNS (PTR) record. In addition, the Diagnostics test will also measure the response times for the mail server.

Domain Health

MXToolbox - Domain Health Report

Using the Domain Health tool, users will be able to check their systems and ensure they are online and performing optimally. The Domain Health feature will execute hundreds of domain/email/network performance tests.

Analyze Headers

MXToolbox - Email Header Analyzer

The Analyze Headers tool will make emails headers readable by parsing them according to RFC 822. In every email, email headers are present. Email headers can provide valuable diagnostic information like anti-spam results, hop delays, and more.

Free Monitoring

MXToolbox - Free Monitoring

MXToolbox offers a free and paid solution pans for its members. Both offer the best-in-class monitoring. With the free subscription plan, users receive one free monitor with access to the top 30 blacklists. With the paid plan, users get access to multiple monitors, more blacklists and access to advanced email delivery tools.

DMARC

MXToolbox - DMARC

DMARC (Domain-based Message Authentication, Reporting, and Conformance) is used for policy distribution. With the DMARC Record Lookup, this tool will check and parse the DMARC Record for the queried domain and will display the DMARC Record. The tool will also run a series of diagnostic checks against the record.

Investigator

MXToolbox - Investigator

The Investigator tool provides detailed information about a domain name, reporting known IP addresses, MX records, Name servers, ASN information, SPF record verification, Blacklist Reputation, and the domain’s Whois Record.

DNS Lookup

MXToolbox - DNS Lookup

With the DNS Lookup, this test will list DNS records for a domain. The list of domains will be displayed in priority order. The DNS lookup is done directly against the domain’s authoritative name server. Changes made to DNS records should appear instantly when tested.

Other Network Tools Available

MXToolbox - All Tools

  • DNS Lookup for MX records
  • Blacklist
  • DNS Lookup for IP Address
  • Test Mail Server
  • DNS Reverse Lookup
  • Whois
  • Check DNS Servers
  • Sender Policy Framework
  • Domain Keys Identified Mail
  • DMARC Lookup
  • DNS Lookup for IPv6
  • DNSKEYT Lookup
  • CERT Lookup
  • DNS Lookup for Location
  • IPSECKEY Lookup

  • ASN Lookup
  • DNSSEC Signature
  • NSEC Lookup
  • DS Lookup
  • NSEC3PARAM
  • Domain Health Report
  • IP and Location
  • DNS Lookup Canoical
  • DNS Lookup Text Record
  • DNS Start of Authority
  • DNS Lookup Service Record
  • Port Status
  • Website Query (http://)
  • Website Query (https://)
  • ICMP – Echo Request
  • ICMP – Traceroute
  • IP Address Blocks

  • Header Analyzer
  • End-toEnd Email Monitoring
  • Subnet Calculator
  • Email Extraction
  • Bulk Lookup
  • Brand Reputation
  • Email Deliverability
  • DNS Propagation
  • Password Generator
  • Email User List
  • DMARC Delivery Report
  • DMARC Report Analyzer
  • DMARC Generator
  • SPF Generator
  • Investigator

With (47) tools offered by MXToolbox, there is no shortage of information a user can access.

8. Pingdom Speed Test

tools.pingdom.com

Pingdom - Homepage Seach Bar

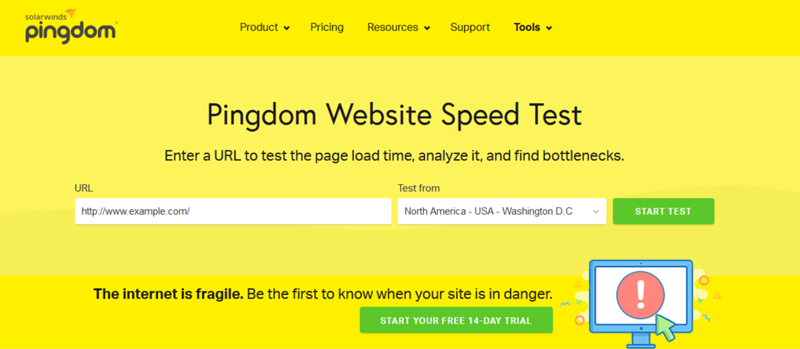
Pingdom is a useful tool when it comes to being performance monitoring for your website. They are cost effective and reliable uptime.

Pingdom uses more than 70 global polling locations which they use to test and verify websites. With Pingdom you can test and evaluate your websites’ performance, interactions and uptime for a better visitor experience.

Creating a faster website

Pingdom - Nobody Likes a Slow Website

Pingdom was built by developers who have a passion for load speed. The product they created is a Website Speed Test which will analyze a website’s load speed. Inside the test, the tool will evaluate a webpage and identify what is fast, slow, too big, and so on.

Unlike other website tools, Pingdom was designed to be feature rich for advances web design experts, but also easy enough to understand by someone who is a novice. It’s an easy to use tool built for all web developers, webmasters, or anyone who wants to improve their website performance.

Speed Test Results

Pingdom - Speed Test Results

After a webpage is tested, the results are given for the following four areas:

  • Performance Grade
  • Page Size
  • Load Time
  • Requests
Improve Page Performance

Pingdom - Improve Page Performance

To improve your webpoages performance, Pingdom monitors the following seven areas for possible issues. Each area tested is given a grade, along with a desription of that individual test and why it’s important to fix any issues that may arise.

  • Avoid empty src or href
  • Put JavaScript at bottom
  • Reduce the number of DOM elements
  • Avoid AlphaImageLoader filter
  • Make favicon small and cacheable
  • Avoid HTTP 404 (Not Found) error
  • Avoid URL redirects
Response Codes

Pingdom - Response Codes

Response Codes, also known as HTTP status codes, are like small notes from the webs server a website is hosted on, indicating how things went when the request to view the page was received.

Content size and Requests by Content Type and Domain

Pingdom - Content Size and Requests by Content Type and Domain

CONTENT SIZE AND REQUESTS BY CONTENT TYPE
When reviewing a webpage, Pingdom will monitor the content size by content type and the requests there of. This test will show what content types are taking up the most resources on your webpage. For instance, images commonly account for a huge portion of the of a webpage’s total size. By reducing, compressing or changing images out all together, you can reduce the resources needed and improve page performance.

CONTENT SIZE AND REQUESTS BY DOMAIN
While reviewing a webpage, Pigndom will test to see which external services and scripts are on your website. Ideally, it’s best to have the least amount of external requests necessary. This will allow your website run better due to each external service carrying its own latency, like TLS handshake delays, DNS lookups, etc.

File Requests

Pingdom - File Requests

The last report offered by Pingdom is the File Requests, which is a waterfall chart of all the individual requests on a webpage. This list of requests will allow administrators or website owners to analyze each request, evaluating what is causing delays or possible performance issues.

9. IP Address Lookup

ip4.me

IP4me - Results

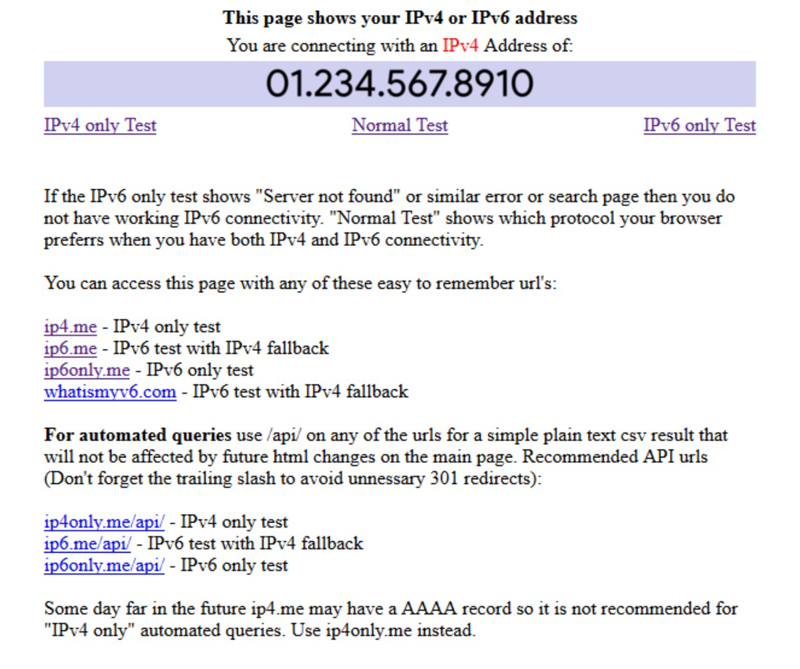
IP4me is a IP Address Lookup tool. When a user visits the website, the tool will automatically display the visitors IP Address on the webpage. If the visitor would like to know their IPv6 Address, the option is abailable on the page and will display the users UIPv6 number.

What is an IP Address?

An IP (Internet Protocol) Address is a unique identifier that links to all online activity a person does. Kind of like an ID card for the digital world. This information follows you with each place you go, carrying with it certain identifiers of who you are and where you come from. It is the way a device is identified as it moves about the Internet and connects to websites and other devices.

Benefit of Knowing an IP Address

As a website developer, this tool is especially handy to give out to customers who are blocked at the server level. Being able to hand the user a simple address to go to will allow the user to get their IP Address without having to dig into their system for the info. This makes whitelisting the IP address simple without having to explain how to acquire an IP address.

Using Other IP Address Retrieval Tools

When it comes to finding an IP address, other websites can be confusing for users if they don’t know what they are looking for. Information is also limited, displaying results for IPv4 or IPv6, but not including both within the tool. Some services will include ads on the page, which can make it difficult for the user and knowing what to look at.

10. Byte Check

bytecheck.com

Byte Check - Homepage

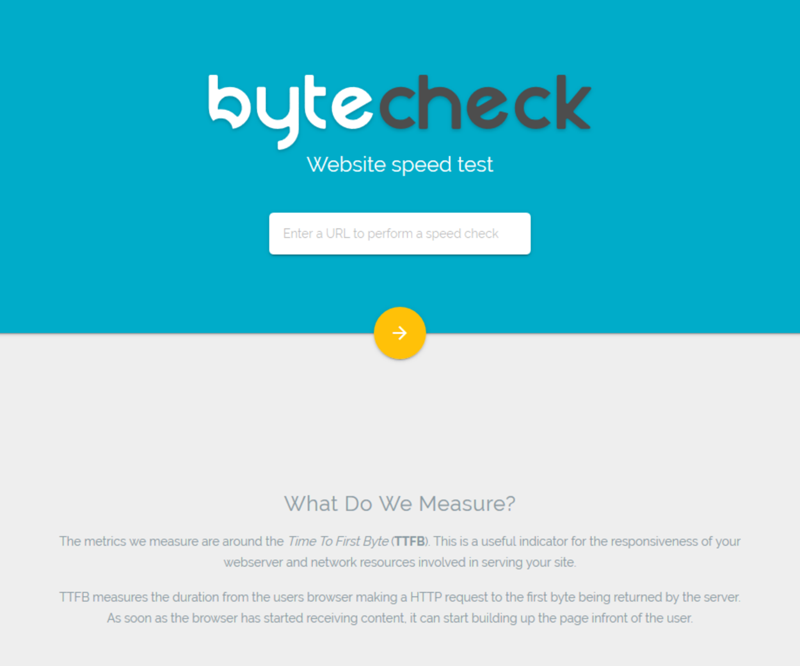
Byte check is a Website Speed Test tool measuring the metrics around the Time To First Byte (TTFB). With Bye Check, visiors can enter their domain URL and evaluate the performance of their webserver, and network resources that are involved with serving their site.

Website Speed Test Results

Byte Check - Website Speed Test Results

Entering the domain URL into the website Speed Test, the tool will review the URL and give a graded report of your website, along with metrics on time alloted for web resources, and webpage statistics.

Webpage Overall Grade

Byte Check - Overall Website Score

The Overall Grade is determined by the TTFB and Total Time to receiove the full request, which is calculated and reported in the form of “Out of 5 Stars” rating. ★ ★ ★ ★ ☆

According to Google, the average Time to First Byte is between 100ms – 500ms, depending on the type of content displayed on the website. For websites that display static content, aiming for 100ms TTFB is ideal. Where as websites with dynamic content should try to aim for the 200ms – 500ms range. In both cases, Google suggests a website should strive to obtain TTFB of 200ms or less.

CASUSES OF A SLOWER TTFB
When it comes to causes of a slow TTFB, these cause could be attributed to the following reasons:

  • High web traffic
  • Network problems
  • Dynamic content: disk usage, disk speed, RAM usage, database setup, database speed
  • Server configuration: PHP/ASP settings, database settings, shared server, and more
Time Spent on Resources

Byte Check - Time by Resources

The results for the TTFB are diosplayed in a waterfall graph. The graph will show a break down of the process order and each calculation of time alloted for each process.

  • DNS
  • Connect
  • Send
  • Wait
  • Receive

Reviewing the process and the time calculated will allow website developers and administrators to concentrate their efforts in those isolated areas, if the time is higher than expected.

Webpage Statistics

Byte Check - Website Statistics

The final pice of information is the status box which displays stats about the testing procedure.

  • HTTP Numerical Code Returned
  • The Total Size of the Downloaded Headers
  • The Total Amount of Bytes Sent in the HTTP Request
  • The Average Speed for the Complete Download
  • The Average Speed for the Complete Upload
  • The Content Type of the Requested Document