
It’s all about the speed baby! Byte Check secures its position as a top 10 ranking website report tool due to its exceptional capabilities in monitoring website performance and ensuring optimal loading speeds. Developed with a focus on speed and user experience, this powerful tool meticulously evaluates various aspects of a website’s performance, including load times, page size, and server response. By generating comprehensive reports and performance metrics, Byte Check empowers website owners and developers to identify areas for improvement and implement necessary optimizations.
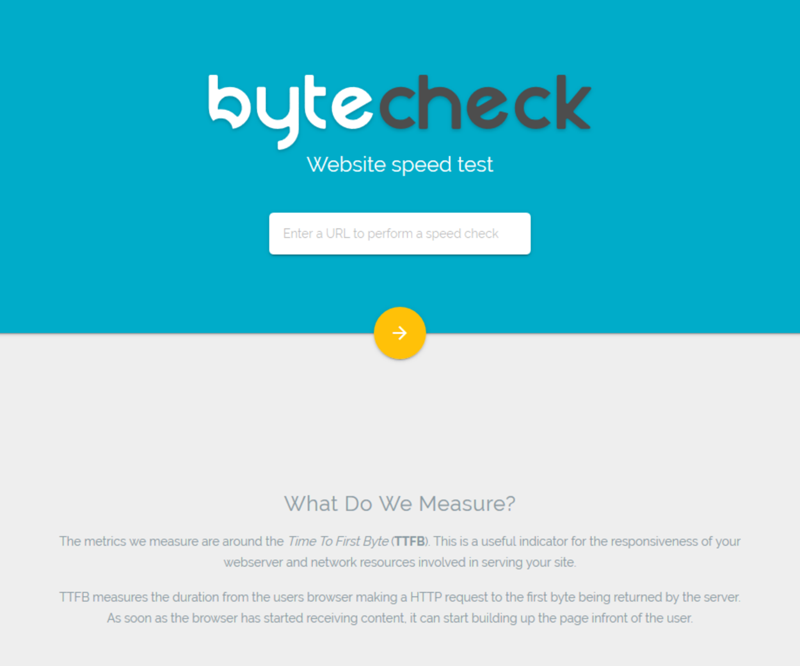
Byte check is a Website Speed Test tool measuring the metrics around the Time To First Byte (TTFB). With Bye Check, visiors can enter their domain URL and evaluate the performance of their webserver, and network resources that are involved with serving their site.
Website Speed Test Results
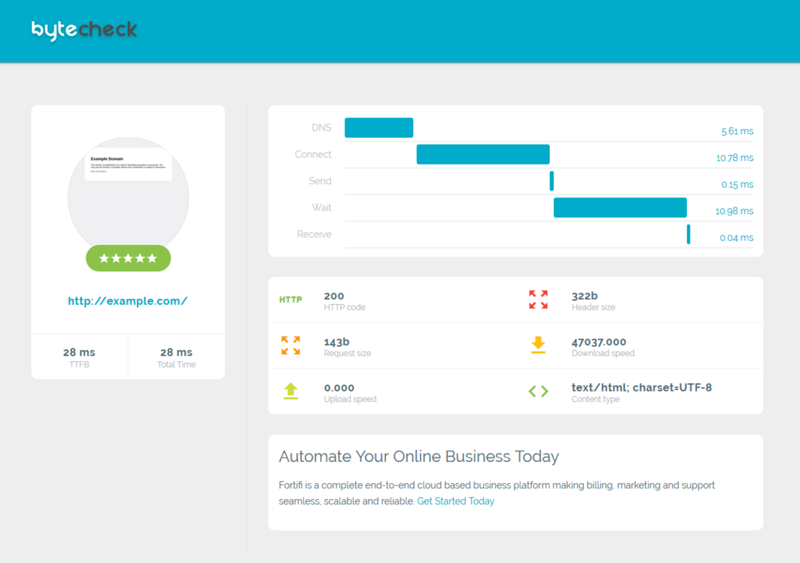
Entering the domain URL into the website Speed Test, the tool will review the URL and give a graded report of your website, along with metrics on time alloted for web resources, and webpage statistics.
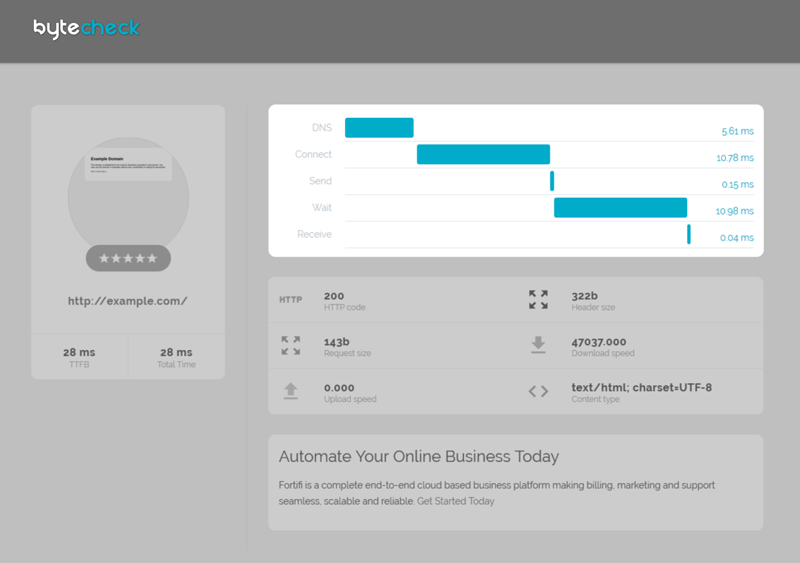
Webpage Overall Grade
The Overall Grade is determined by the TTFB and Total Time to receiove the full request, which is calculated and reported in the form of “Out of 5 Stars” rating. ★ ★ ★ ★ ☆
According to Google, the average Time to First Byte is between 100ms – 500ms, depending on the type of content displayed on the website. For websites that display static content, aiming for 100ms TTFB is ideal. Where as websites with dynamic content should try to aim for the 200ms – 500ms range. In both cases, Google suggests a website should strive to obtain TTFB of 200ms or less.
CASUSES OF A SLOWER TTFB
When it comes to causes of a slow TTFB, these cause could be attributed to the following reasons:
- High web traffic
- Network problems
- Dynamic content: disk usage, disk speed, RAM usage, database setup, database speed
- Server configuration: PHP/ASP settings, database settings, shared server, and more
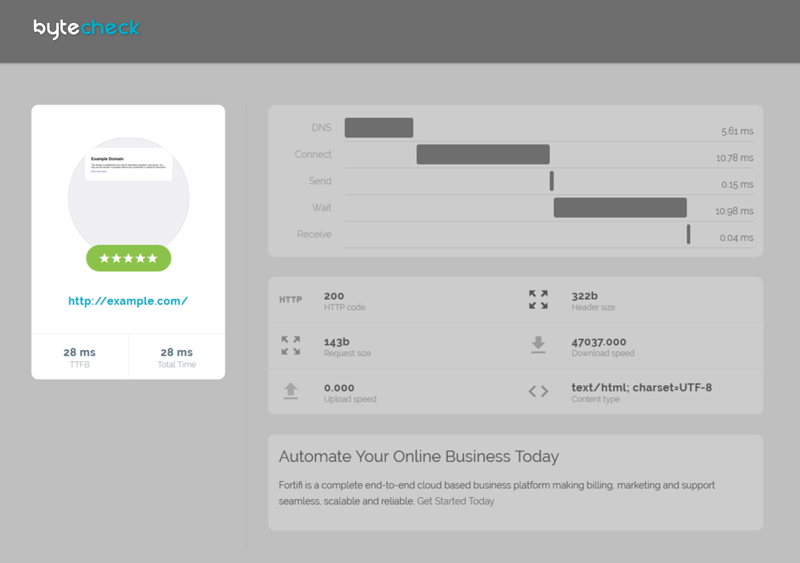
Time Spent on Resources
The results for the TTFB are diosplayed in a waterfall graph. The graph will show a break down of the process order and each calculation of time alloted for each process.
- DNS
- Connect
- Send
- Wait
- Receive
Reviewing the process and the time calculated will allow website developers and administrators to concentrate their efforts in those isolated areas, if the time is higher than expected.
Webpage Statistics
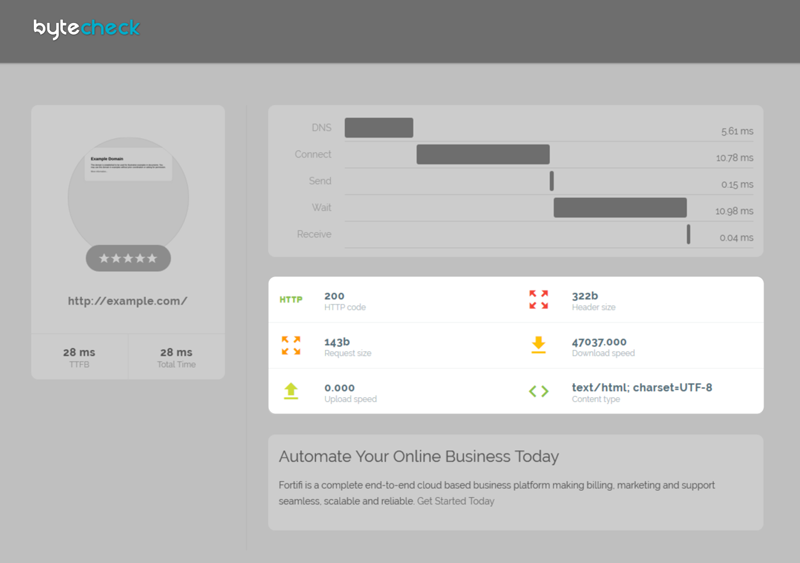
The final pice of information is the status box which displays stats about the testing procedure.
- HTTP Numerical Code Returned
- The Total Size of the Downloaded Headers
- The Total Amount of Bytes Sent in the HTTP Request
- The Average Speed for the Complete Download
- The Average Speed for the Complete Upload
- The Content Type of the Requested Document